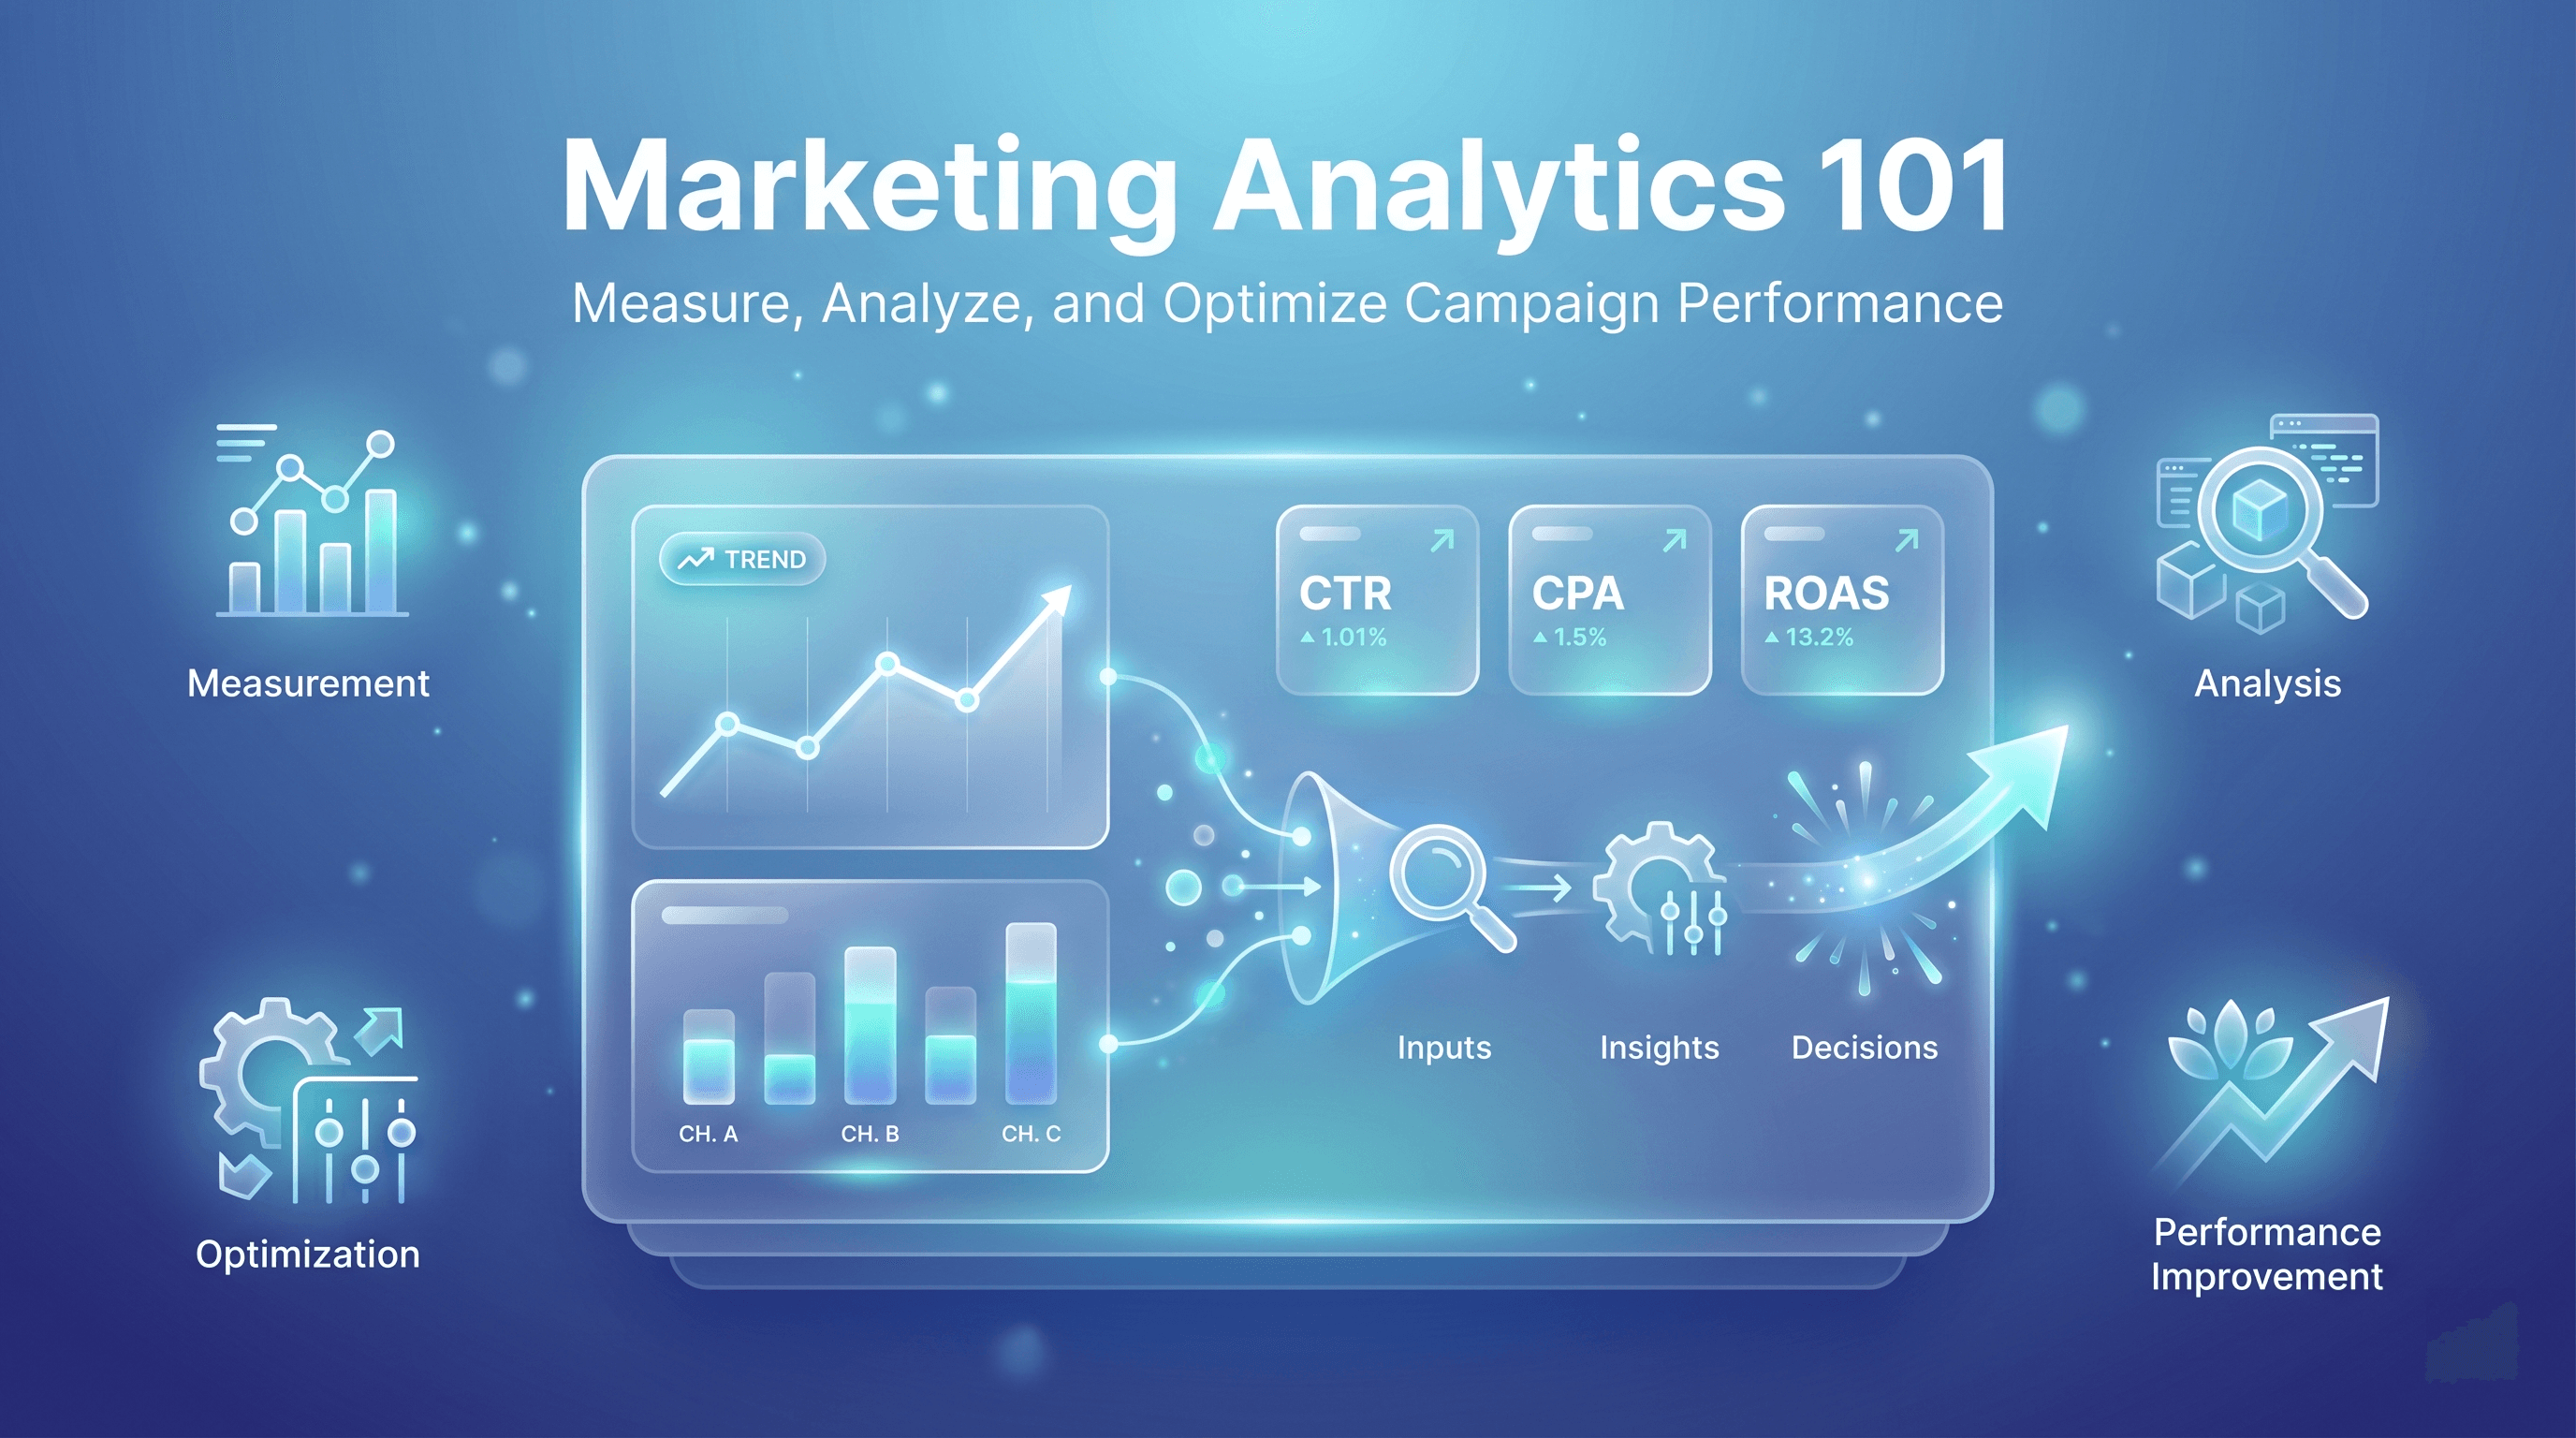
Marketing Analytics 101: How to Measure, Analyze, and Optimize Campaign Performance
Marketing analytics is the practice of collecting, analyzing, and interpreting data to understand how marketing activities influence business outcomes.
Marketing analytics is no longer a “nice to have” reserved for enterprise teams with data scientists. For small businesses and startups, it’s the difference between guessing and deciding. Between spending money and deploying capital.
This guide breaks down what marketing analytics actually is, how to interpret the most common metrics without getting lost in dashboards, and—most importantly—how to turn data into better decisions that compound over time.
What Is Marketing Analytics (and Why It Actually Matters)
At its core, marketing analytics is the practice of collecting, analyzing, and interpreting data to understand how marketing activities influence business outcomes.
But here’s the critical distinction many teams miss:
Marketing analytics is not about tracking everything.
– “It’s about tracking the right signals at the right stage of growth.”
Early-stage companies often over-index on vanity metrics (impressions, likes, traffic spikes) while under-measuring the metrics that actually determine survival: efficiency, conversion, and return.
Analytics in marketing matters because it allows you to:
- Allocate budget based on evidence, not instinct
- Identify which channels deserve more scale
- Detect performance decay early (before results collapse)
- Tie marketing activity to revenue, not just activity
Without analytics, optimization is impossible. You can’t improve what you can’t diagnose.
An Operator’s Framework: The Signal Ladder
Before diving into analytics types and metrics, it helps to anchor everything in a simple mental model.
The Signal Ladder (used in our org) prioritizes metrics by decision value, not popularity:
- Exposure Signals – Did anyone see this?
- Engagement Signals – Did anyone care?
- Intent Signals – Did anyone act?
- Outcome Signals – Did it drive business value?
Most teams stop at Level 2. Sustainable growth happens at Levels 3 and 4. Keep this ladder in mind as we break things down.
Types of Marketing Analytics
Different questions require different types of analysis. Confusing them leads to bad decisions.
Descriptive Analytics: What Happened?
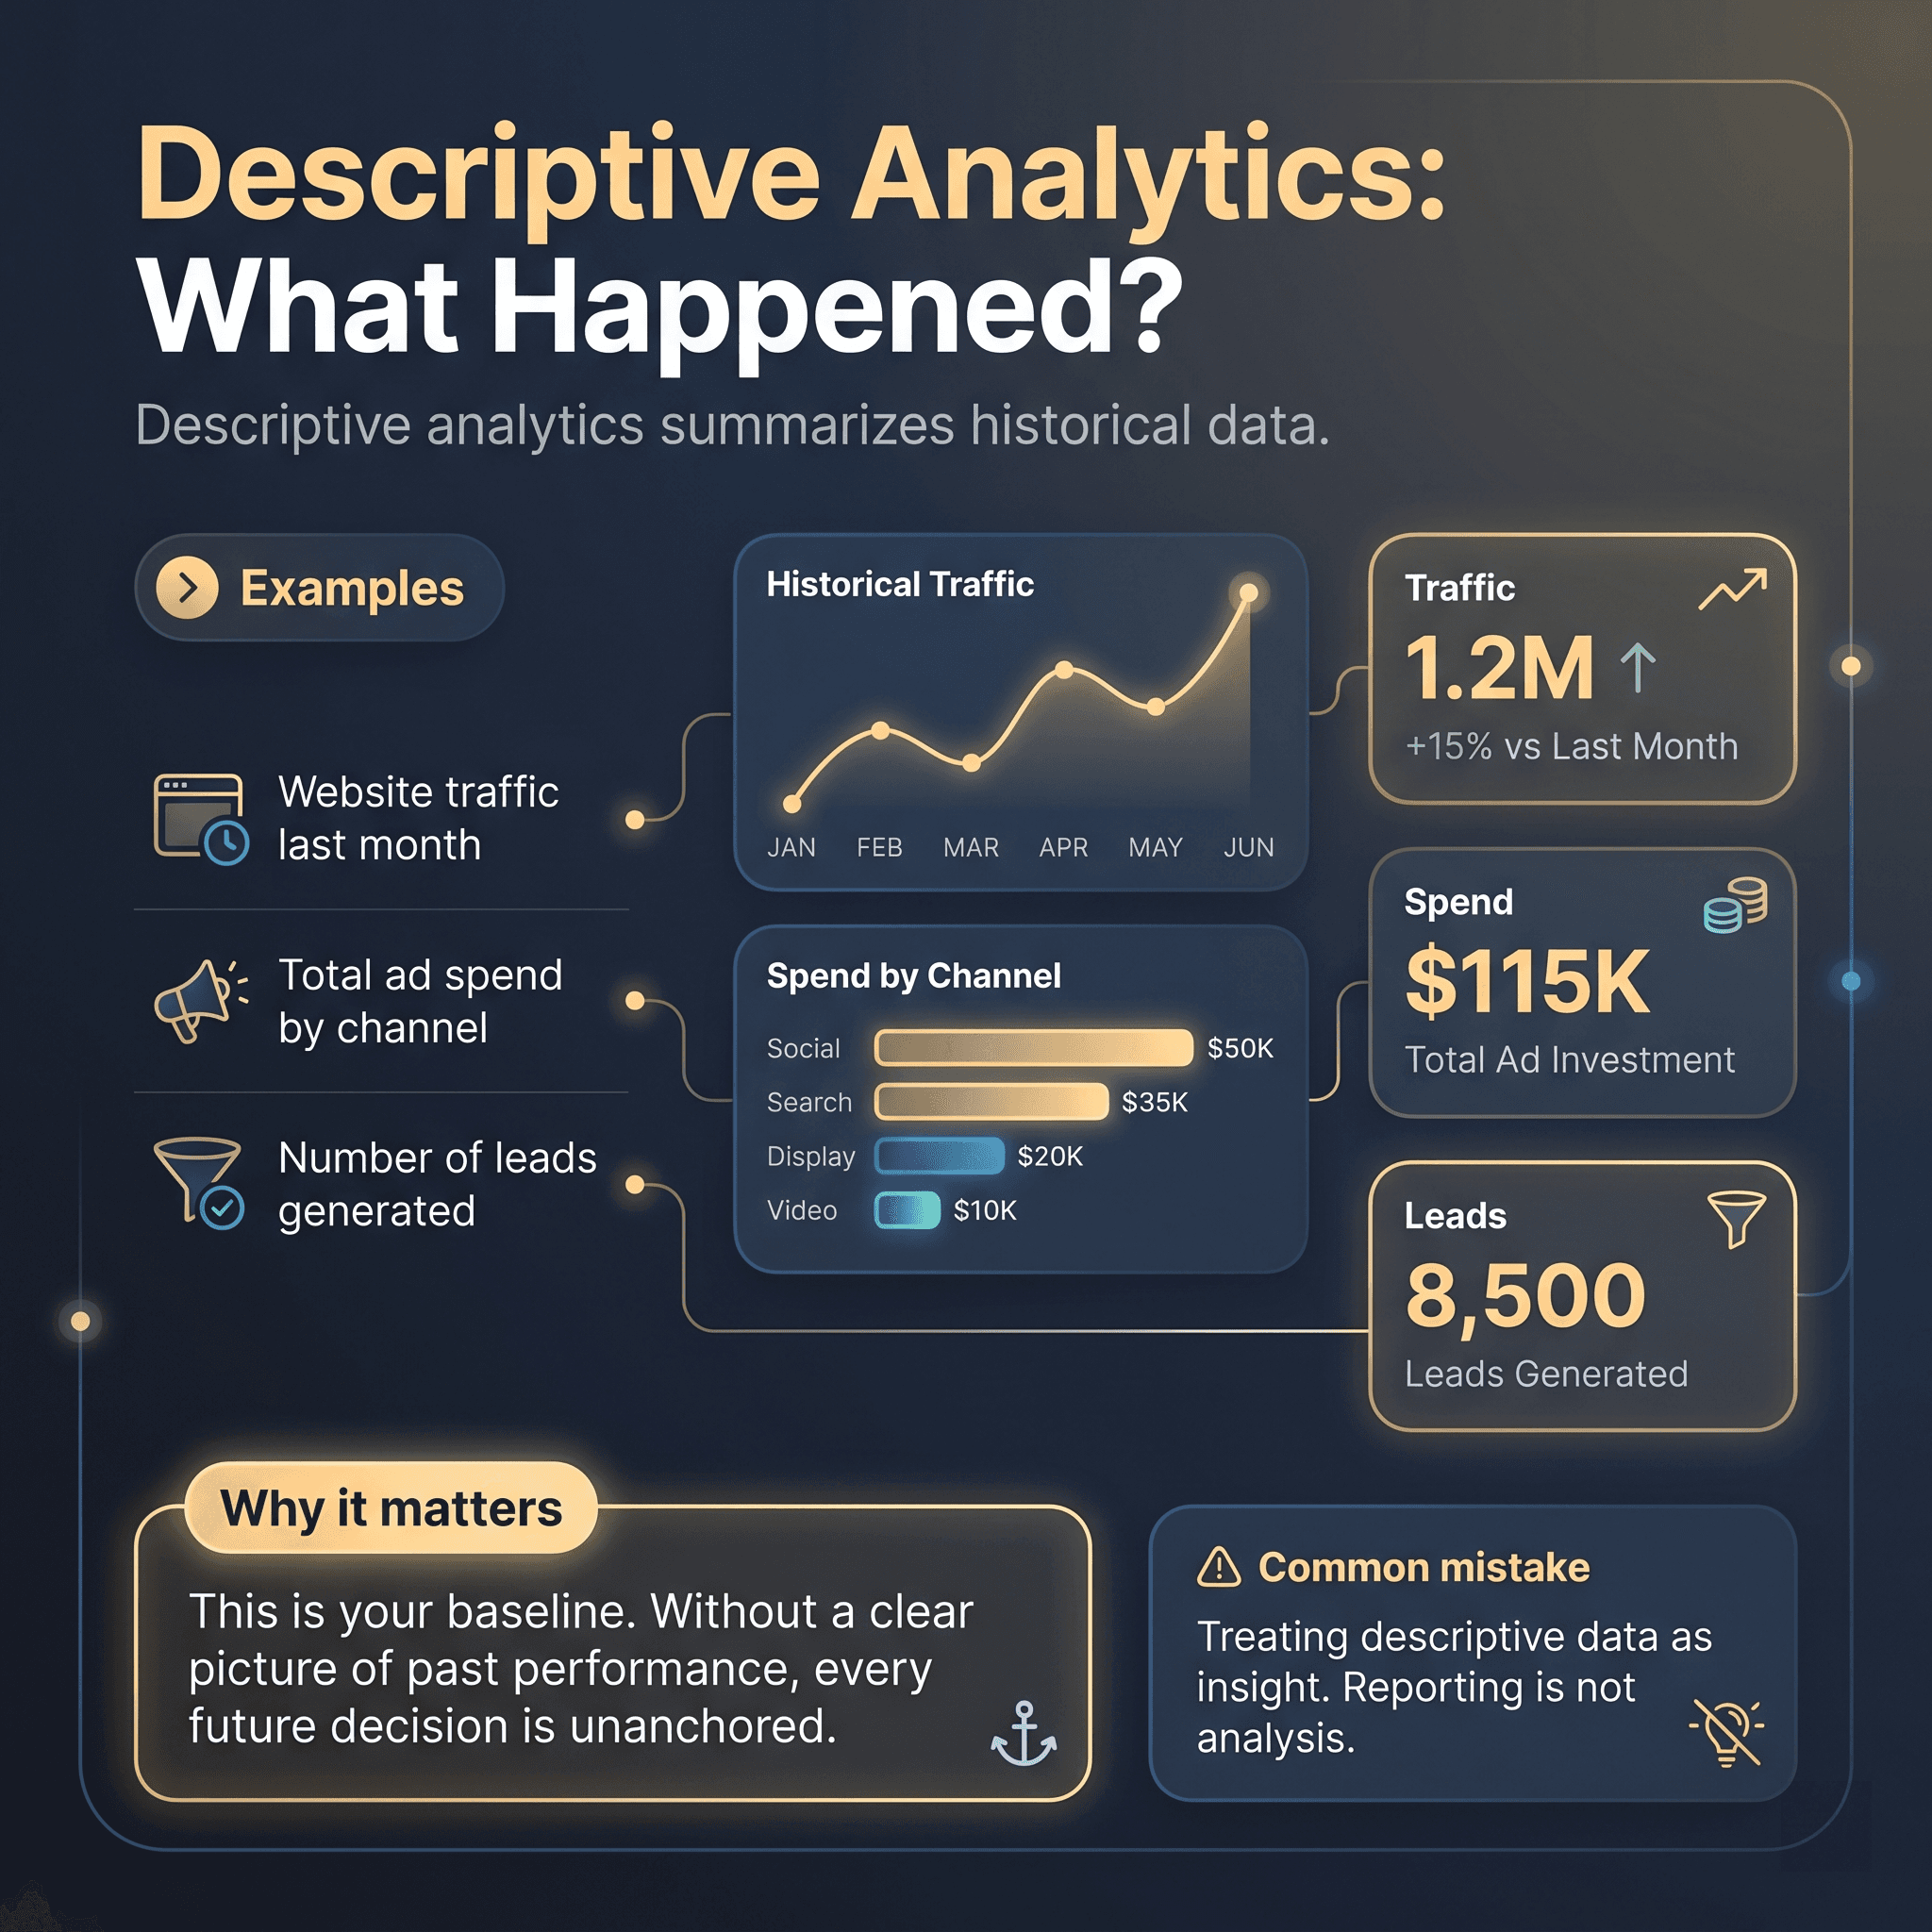
Descriptive analytics summarizes historical data.
Examples:
- Website traffic last month
- Total ad spend by channel
- Number of leads generated
Why it matters:
This is your baseline. Without a clear picture of past performance, every future decision is unanchored.
Common mistake:
Treating descriptive data as insight. Reporting is not analysis.
Diagnostic Analytics: Why Did It Happen?
Diagnostic analytics looks for cause-and-effect relationships.
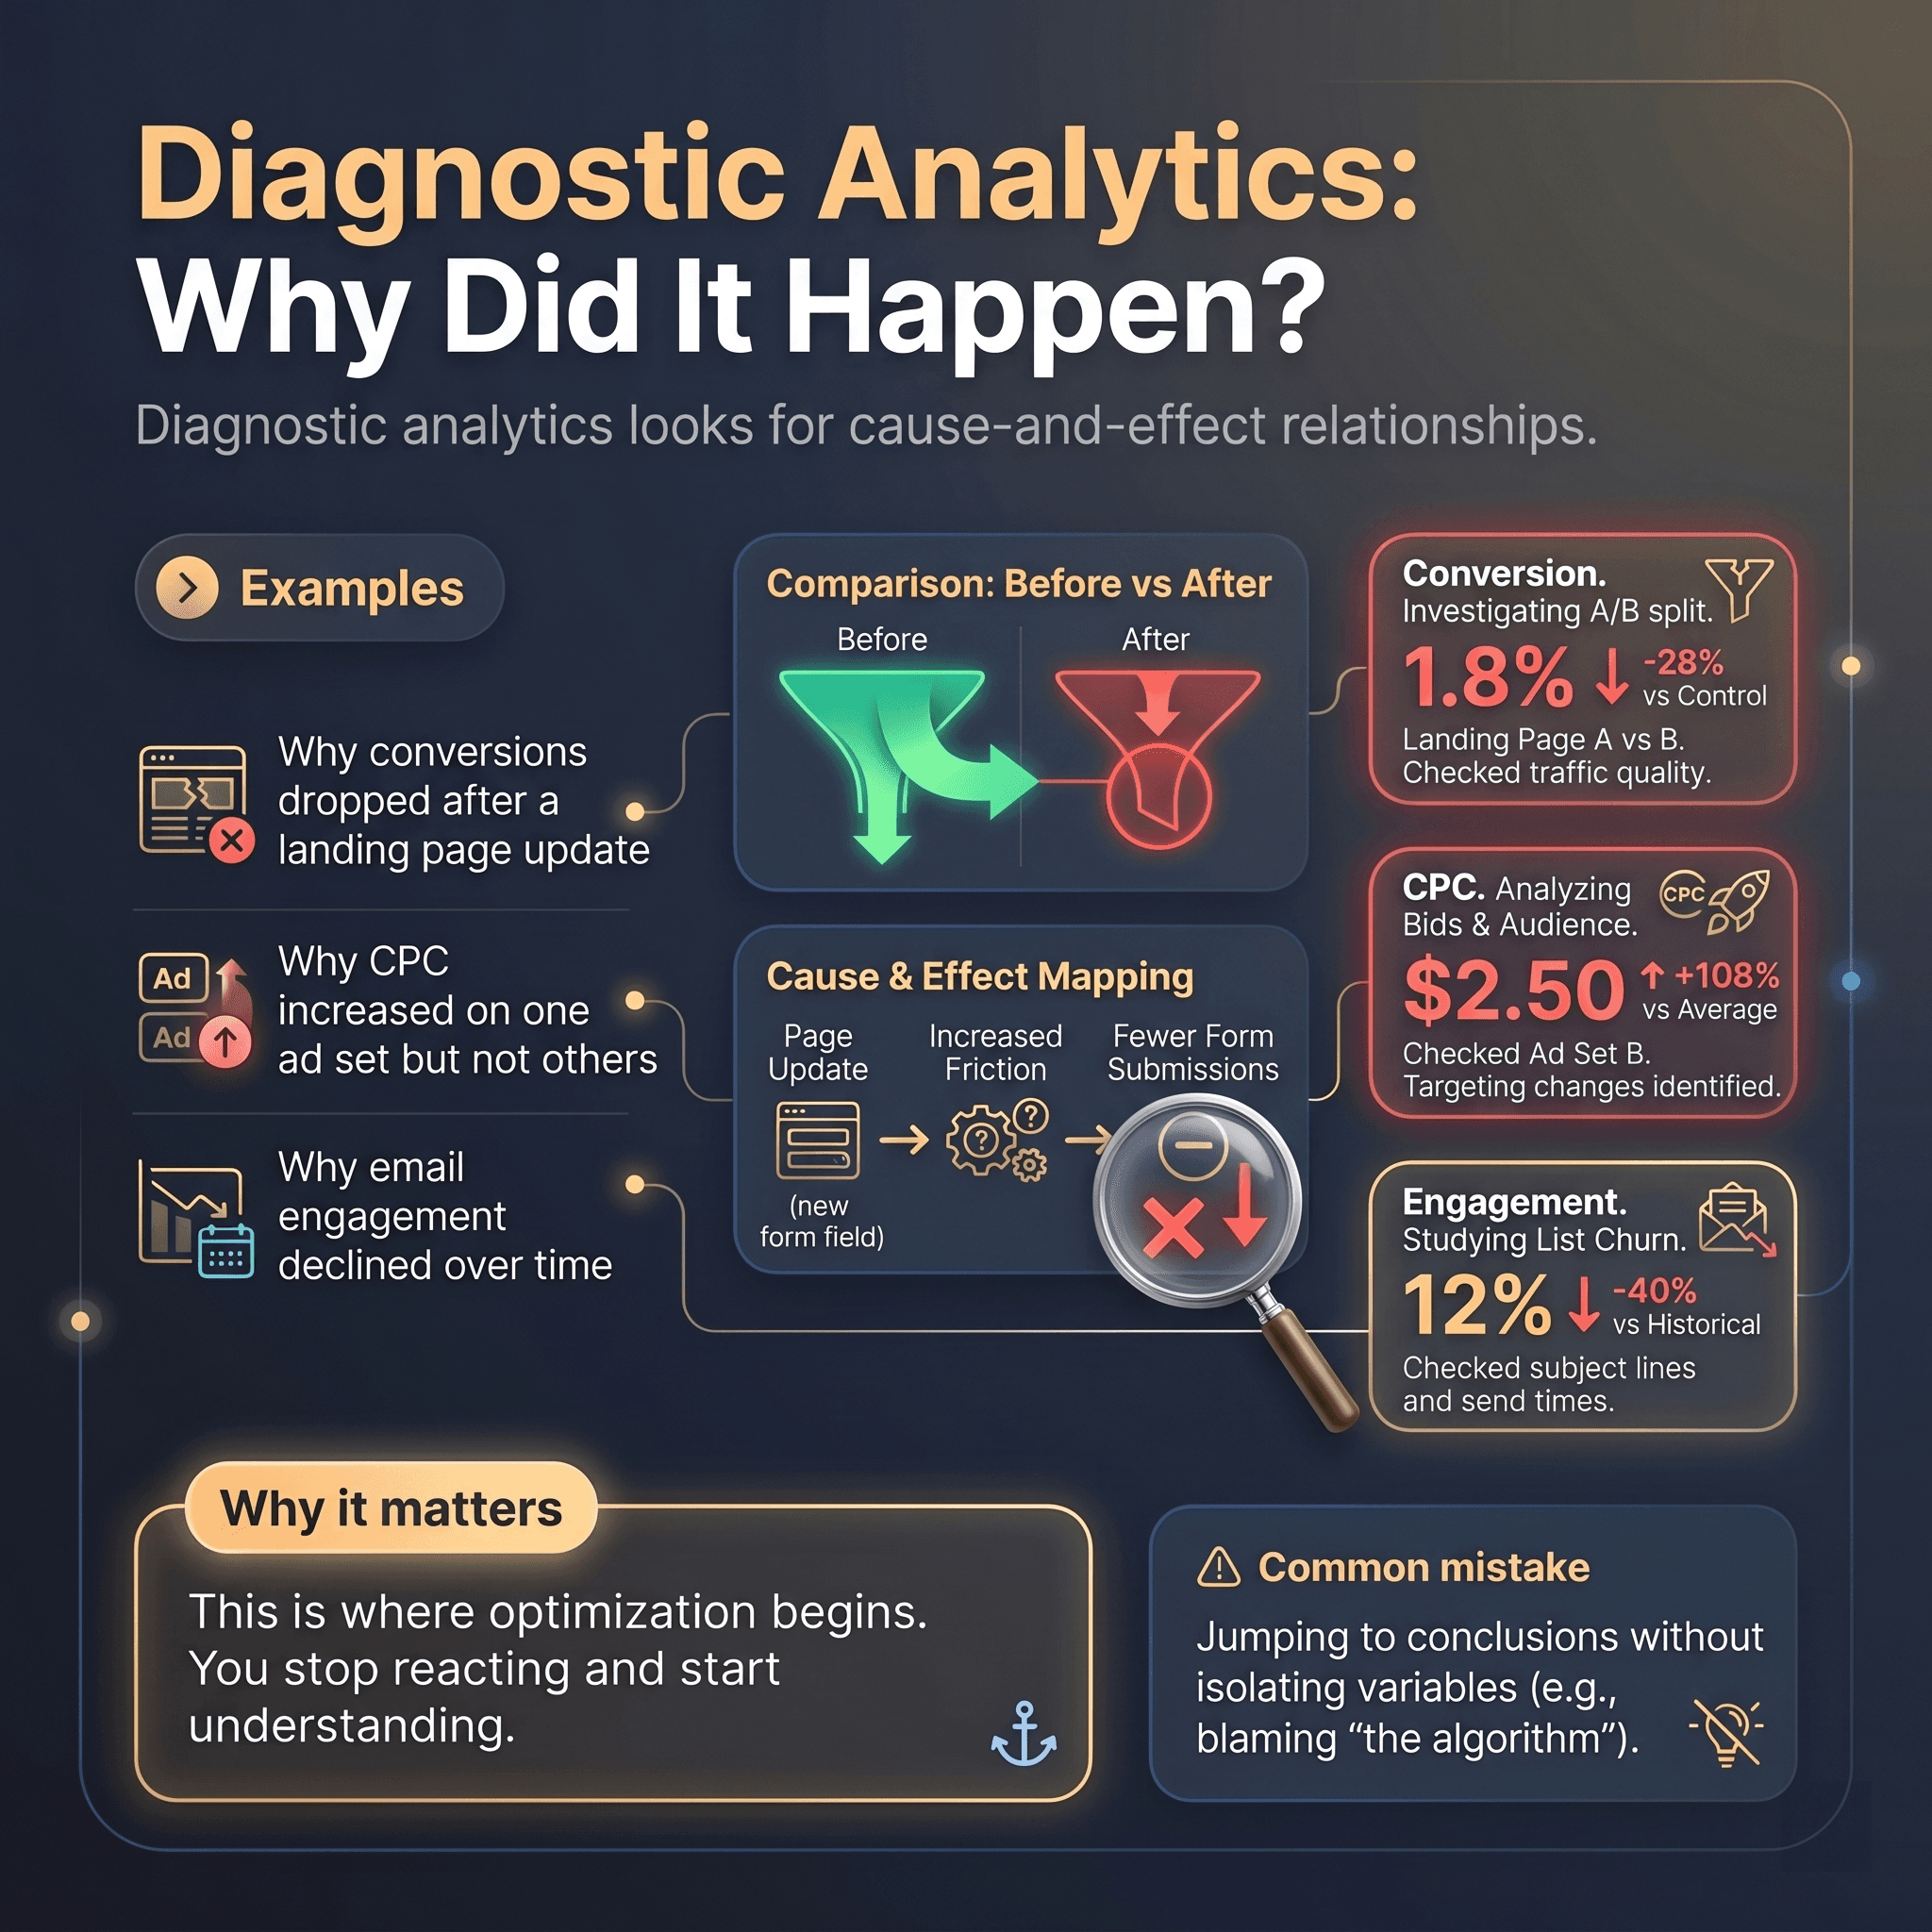
Examples:
- Why conversions dropped after a landing page update
- Why CPC increased on one ad set but not others
- Why email engagement declined over time
Why it matters:
This is where optimization begins. You stop reacting and start understanding.
Common mistake:
Jumping to conclusions without isolating variables (e.g., blaming “the algorithm”).
Predictive Analytics: What’s Likely to Happen Next?
Predictive analytics uses patterns and trends to forecast outcomes.

Examples:
- Projected CAC if spend increases 20%
- Expected conversion rate based on past cohorts
- Seasonal performance trends
Why it matters:
Prediction enables planning. It reduces risk when scaling campaigns.
Common mistake:
Treating predictions as guarantees instead of probabilities.
Prescriptive Analytics: What Should We Do About It?
Prescriptive analytics recommends actions based on predicted outcomes.
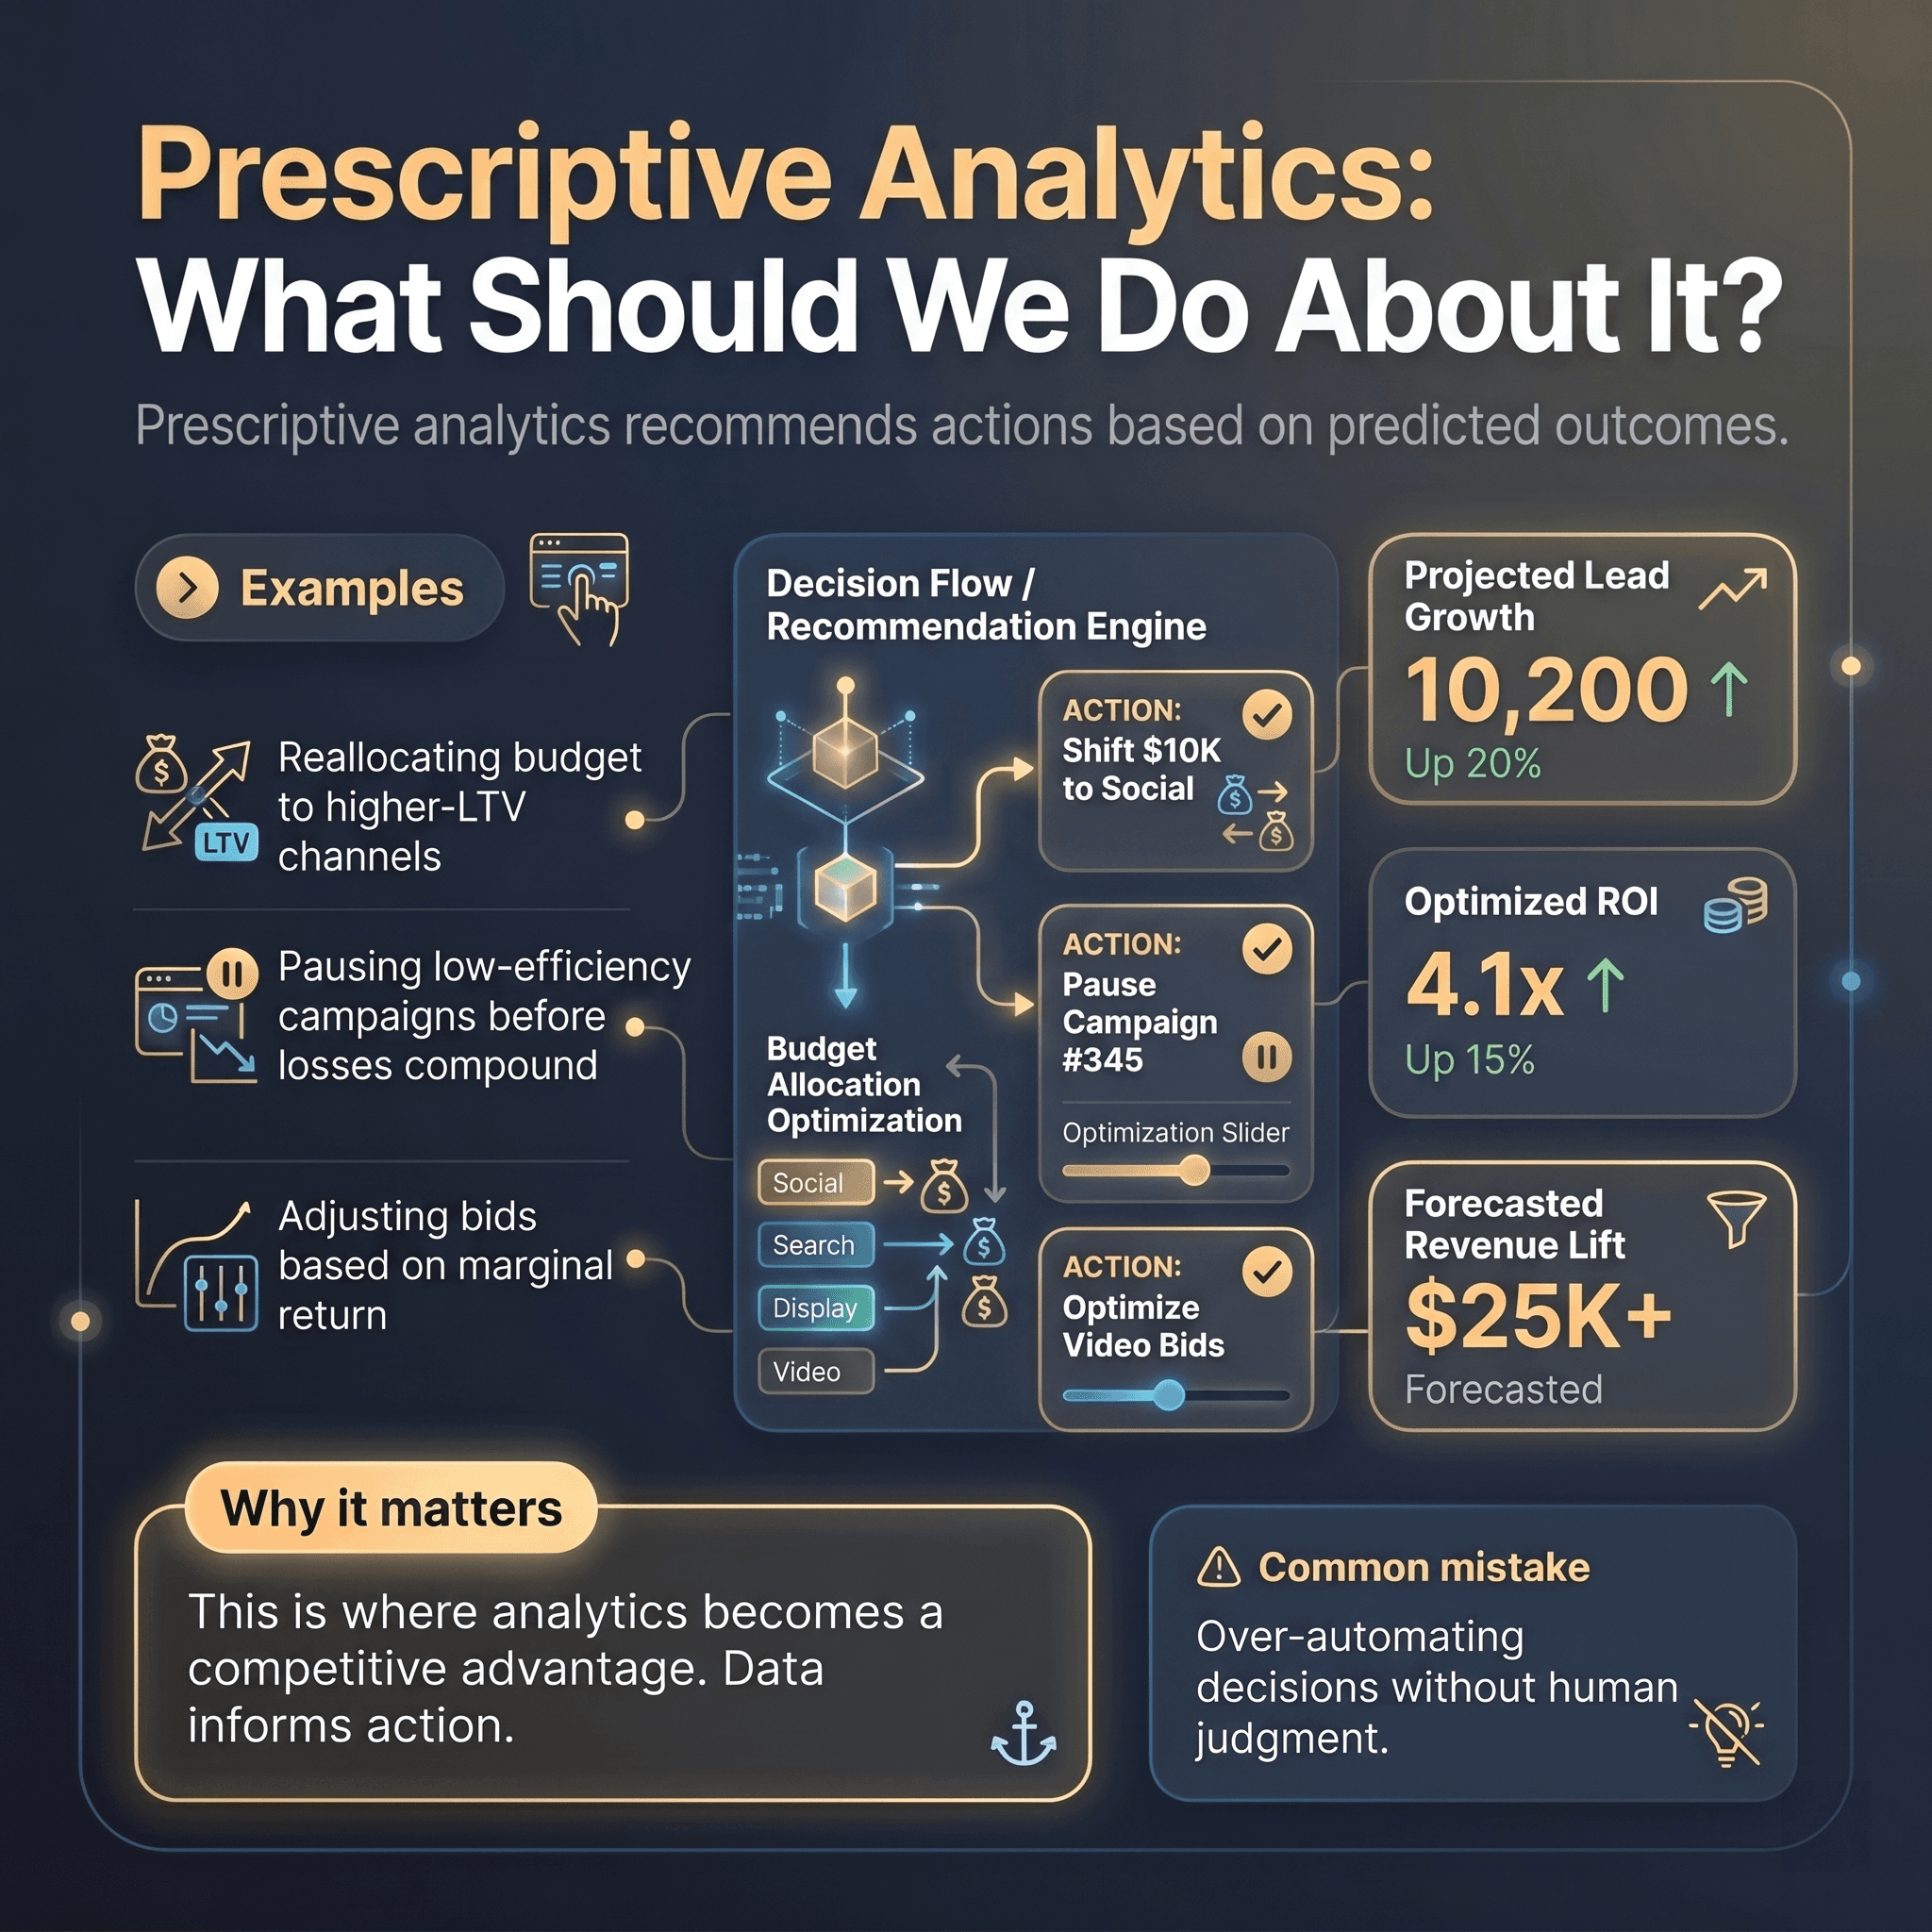
Examples:
- Reallocating budget to higher-LTV channels
- Pausing low-efficiency campaigns before losses compound
- Adjusting bids based on marginal return
Why it matters:
This is where analytics becomes a competitive advantage. Data informs action.
Common mistake:
Over-automating decisions without human judgment.
Commonly Cited Metrics in Marketing Analytics (What They Mean in Practice)
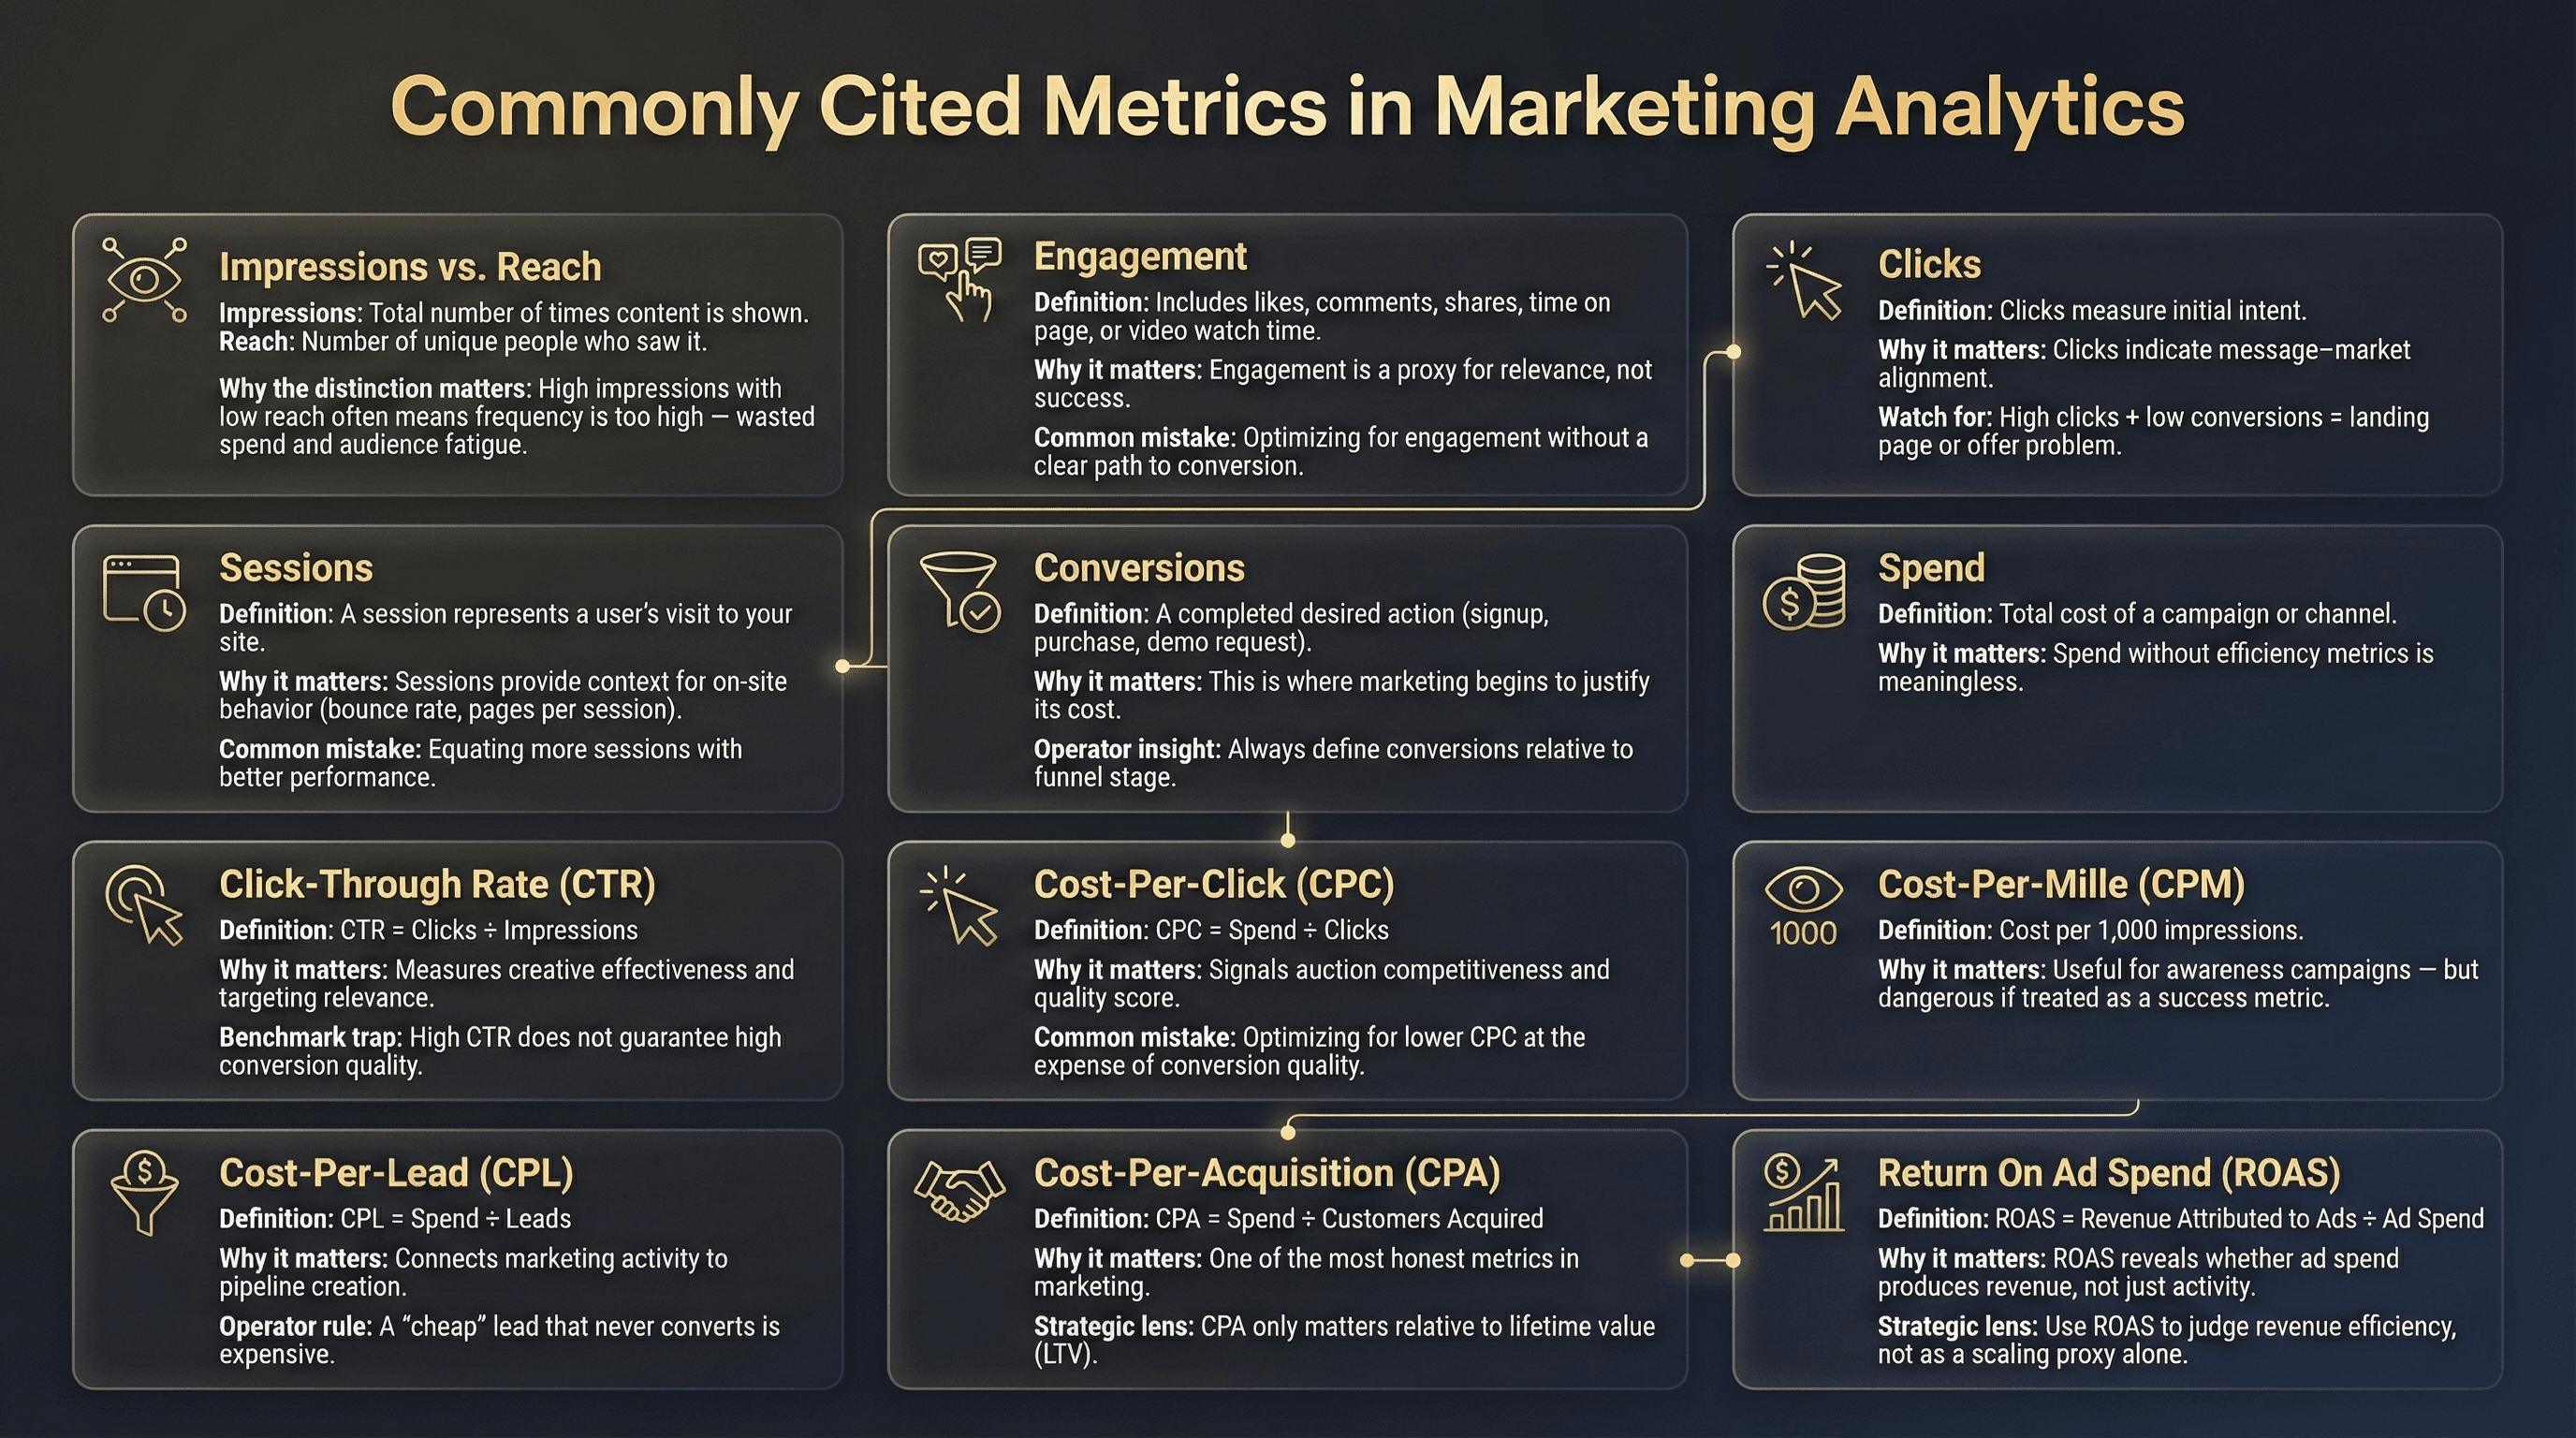
Below are the most common metrics you’ll encounter—interpreted through a strategic lens, not a glossary.
Impressions vs. Reach
- Impressions: Total number of times content is shown
- Reach: Number of unique people who saw it
Why the distinction matters:
High impressions with low reach often means frequency is too high—wasted spend and audience fatigue.
Engagement
Includes likes, comments, shares, time on page, or video watch time.
Why it matters:
Engagement is a proxy for relevance, not success.
Common mistake:
Optimizing for engagement without a clear path to conversion.
Clicks
Clicks measure initial intent.
Why it matters:
Clicks indicate message-market alignment.
Watch for:
High clicks + low conversions = landing page or offer problem.
Sessions
A session represents a user’s visit to your site.
Why it matters:
Sessions provide context for on-site behavior (bounce rate, pages per session).
Common mistake:
Equating more sessions with better performance.
Conversions
A conversion is a completed desired action (signup, purchase, demo request).
Why it matters:
This is where marketing begins to justify its cost.
Operator insight:
Always define conversions relative to funnel stage.
Spend
Total cost of a campaign or channel.
Why it matters:
Spend without efficiency metrics are meaningless.
Click-Through Rate (CTR)
CTR = Clicks + Impressions
Why it matters:
Measures creative effectiveness and targeting relevance.
Benchmark trap:
Measures creative effectiveness and targeting relevance.
Cost-Per-Click (CPC)
CPC = Spend ÷ Clicks
Why it matters:
Signals auction competitiveness and quality score.
Common mistake:
Optimizing for lower CPC at the expense of conversion quality.
Cost-Per-Mille (CPM)
CPM = Cost per 1,000 impressions
Why it matters:
Useful for awareness campaigns—but dangerous if treated as a success metric.
Cost-Per-Lead (CPL)
CPL = Spend ÷ Leads
Why it matters:
CPL connects marketing activity to pipeline creation.
Operator rule:
A “cheap” lead that never converts is expensive.
Cost-Per-Acquisition (CPA)
CPA = Spend ÷ Customers Acquired
Why it matters:
CPA is one of the most honest metrics in marketing.
Strategic lens:
CPA only matters relative to lifetime value (LTV).
Return On Ad Spend (ROAS)
ROAS = Revenue Attributed to Ads ÷ Ad Spend
Why it matters:
ROAS reveals whether ad spend produces revenue, not just activity.
Strategic lens:
Use ROAS to judge revenue efficiency, not as a scaling proxy alone.
Turning Analytics Into Optimization (Where Most Teams Fail)
Data does not create growth. Decisions do.
To move from measurement to optimization:
- Tie every metric to a decision it informs
- Review trends, not snapshots
- Segment by channel, audience, and intent
- Optimize constraints (budget, attention, conversion friction)
The biggest misconception:
More tools = better analytics.
In reality, clarity beats complexity.
Final Thought: Analytics Is a Discipline, Not a Dashboard
Marketing analytics isn’t about building prettier reports. It’s about building confidence in decision-making.
When analytics is done right:
- Budget conversations become strategic, not emotional
- Optimization becomes systematic, not reactive
- Marketing earns its seat as a growth function—not a cost center
If you treat analytics as a feedback loop—not a scoreboard—you’ll outperform teams with far bigger budgets but far less clarity.